* Updates daily against Treasury, with a linear vector from a defined starting point which is currently:
Up until 2011-2-28 I used a vector extending from 2002-10-30, when congress really started spending again. Since the rate of change did not seem to be altering significantly since 2008 (and even accelerating) I switched to the more recent starting point. The former increase per second (as a linear vector to today) was:
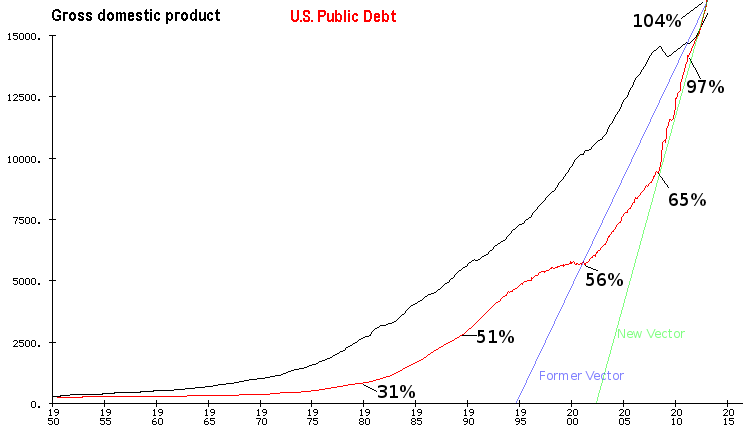
If the former linear vector were extended back in time, the current deficit would have taken less than 15 years to accumulate (see below). If we use a vector starting from 2008, it only takes half that time.
** The per-worker value is using 2017 BLS Full-time worker figures. Part time workers would presumably reduce your share, this is just an approximation (on the other hand there are many more full-time workers, and I used 40h day, not 35-40 as the BLS does). Another way to calculate it would be to calculate your taxes paid as a share of the Federal government's total taxes taken in, then divide that into the debt. The "salary" was a conversion of the increase per second into 250 8h days per year. Obviously with a tax system that varies based on income, your actual contribution to the debt would be lower if your real salary was lower. However if you are middle-class, it should be approximately right.
With regards to GDP, about 20% of current GDP is government spending. There are some people who note that debt was an enormous fraction of GDP in response to the Great Depression and WWII. I'd like to point out that private and state debt was much much lower back then, offering other areas to leverage up. That wiggle room is now gone. And of course at the time the US was in an enormous position of power both in terms of production and monetary leverage relative to a WWII-torn world that it is not in, now.
Oh, and 89% of the growth in GDP disappears if you factor in currency inflation. Actual current GDP (and debt) in 1950 dollars is 1.6 trillion. That works out to about 2¾% annual growth in "real" GDP, year over year from 1950. Of course, population growth has been 1¼% year over year since then, which has GDP rate outstripping population by 1½%. This is all purely using the current CPI calculations of course, which naturally change over time and are more of an approximation.